This article contains affiliate links. If you click on a link in this article, I may earn a small commission at no extra cost to you.
Ways to pick up free Bitcoin:
Method #1: Open an Uphold wallet using this link. Buy or sell $250 in crypto in the first 30 days, get $20 in free BTC.
Method #2: Sign up for Nexo using this link. Top up your account with $500 in crypto and complete a few tasks. Make sure your assets are still worth $500 in 30 days and you will receive $35 in free BTC.
Method #3: Open a Coinbase account using this link. Buy $20 in crypto, get $20 in free BTC.
Happy HODLING!
Month Fifty – UP 204%
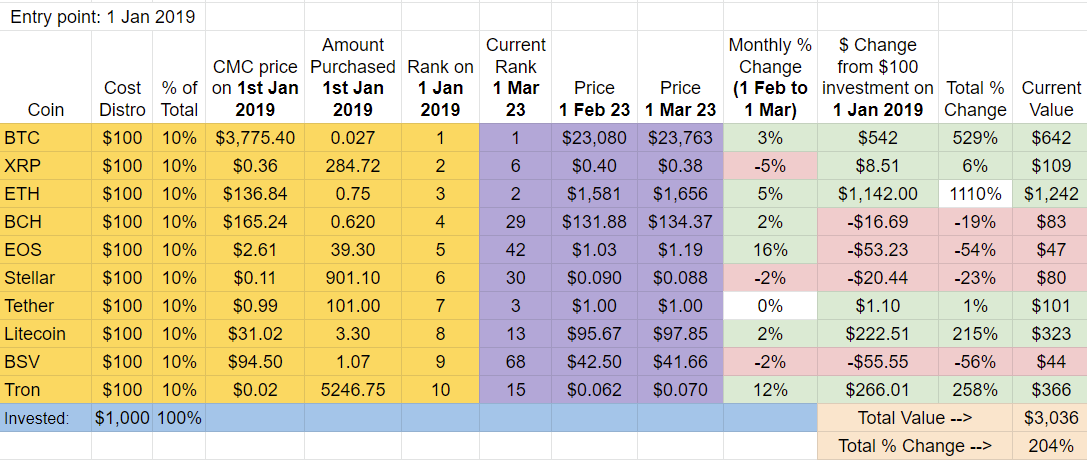
The 2019 Top Ten Crypto Index Fund consists of: BTC, XRP, ETH, BCH, EOS, Stellar, USDT, Litecoin, BSV, and Tron.
February highlights for the 2019 Top Ten Crypto Portfolio:
- EOS and Tron are the best performers this month.
- Ethereum maintains a strong overall lead since January 2019. Second place is Bitcoin followed by third place Tron.
February Ranking and Dropout Report
Here’s the difference in rank since January 2018:

Top Ten dropouts since January 2019: After fifty months, 60% of the cryptos that started in the Top Ten in January 2019 have been knocked out. EOS, Litecoin, BSV, Stellar, Bitcoin Cash, and Tron are out of the Top Ten replaced by BNB, BUSD, DOGE, ADA, MATIC, and USDC
BSV has fallen the furthest in rank so far (#68).
February Winners and Losers
February Winners – EOS (+16%) followed by Tron (+12%).
February Losers – XRP fell -5% in February, making it the worst performer of the month.
Overall Update: ETH far ahead of the pack, 60% of cryptos in positive territory, BSV at the bottom
ETH (+1,110% since Jan. 2029) continues to be the best performer of this group, by far. In distant second place is BTC (+529%) followed by third place Tron (+258%).
The $100 investment into first place ETH on January 1st, 2019 is currently worth $1,242.
After fifty months, 60% of the cryptos in the 2019 Top Ten Portfolio are in positive territory. The worst performer is BSV (-56%).
Total Market Cap for the Entire Cryptocurrency Sector:
There was no easy way to do so at the time, but if you were able to capture the entire cryptocurrency market since January 2019, you would be up +743%
This is still behind first place ETH (+1,040%) but much better than the rest of the Top Ten cryptos, including second place Bitcoin (+529%).
The total market is performing much better than the Top Ten approach (+204%) as well.
Crypto Market Cap Low Point in the 2019 Top Ten Crypto Index Experiment: $114B in January 2019.
Crypto Market Cap High Point in the 2019 Top Ten Crypto Index Experiment: $2.65T in October 2021.
Bitcoin Dominance:

BitDom ended the month at 42.3%. As you can see on the chart above, it has remained fairly steady for nearly two years.
For context, here are the high and low points of BTC domination over the life of the 2019 Experiment:
Low Point in the 2019 Top Ten Crypto Index Experiment: 38.1% in November 2022.
High Point in the 2019 Top Ten Crypto Index Experiment: 70.5% in August 2019.
Overall return on $1,000 investment since January 1st, 2019:
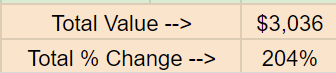
After fifty months, the value of the initial $1000 investment is $3,036, up +204%. This is down from November 2021’s all time high of +665% for the 2019 Portfolio.
Below is a table summarizing the monthly ROI over the life of the 2019 Top Ten Index Fund experiments, providing a pretty good sense of the journey up to this point:
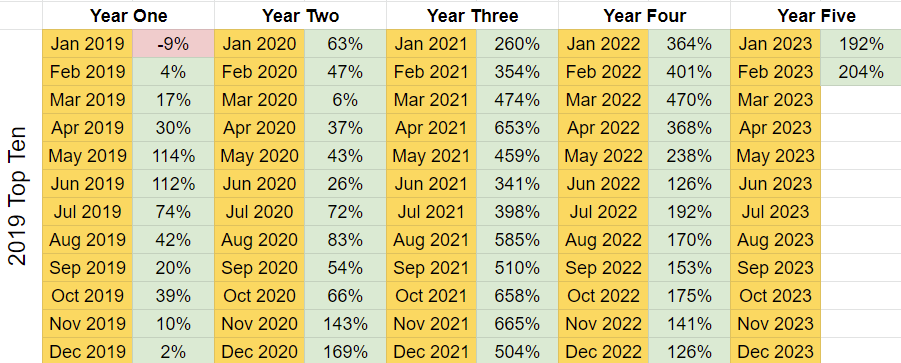
Fairly steady upward movements punctuated by massive dips. During the Zombie Apocalypse in March 2020, for example, the 2019 Top Ten Portfolio was returning only +6%.
Although the 2019 Top Ten Portfolio is up +204%, it is still a distant second place behind the 2020 Top Ten Portfolio which is up +358%.
Combining the 2018, 2019, 2020, 2021, 2022, and 2023 Top Ten Crypto Portfolios
Speaking of other Top Ten Portfolios, let’s put them all together now:
- 2018 Top Ten Experiment: down -42% (total value $578)
- 2019 Top Ten Experiment: up +204% (total value $3,036)
- 2020 Top Ten Experiment: up +358% (total value $4,578) (best performing portfolio)
- 2021 Top Ten Experiment: up +81% (total value $1,811)
- 2022 Top Ten Experiment: down -72% (total value $282) (worst performing portfolio)
- 2023 Top Ten Experiment: up +34% (total value $1,342)
So overall? Taking the six portfolios together, here’s the bottom bottom bottom bottom bottom bottom line:
After a $6,000 total investment in the 2018, 2019, 2020, 2021, 2022, and 2023 Top Ten Cryptocurrencies, the combined portfolios are worth $11,627.
That’s up +94% on the combined portfolios. The peak for the combined Top Ten Index Fund Experiment Portfolios was November 2021’s all time high of +533%.
Here’s the combined monthly ROI since I started tracking the metric in January 2020:

In summary: That’s a +94% gain by investing $1k on whichever cryptos happened to be in the Top Ten on January 1st (including stablecoins) for six straight years.
Comparison to S&P 500:
I’m also tracking the S&P 500 as part of the experiments to have a comparison point with traditional markets.

Because the S&P 500 Index is up 58% since January 2019, the initial $1k investment I put into crypto fifty months ago would be worth $1,580 had it been redirected to the S&P 500 in January 2019.
But what if I took the same world’s-slowest-dollar-cost-averaging $1,000-per-year-on-January-1st-Crypto-Index-Fund-Experiment approach with the S&P 500? It would yield the following:
- $1000 investment in S&P 500 on January 1st, 2018 = $1,480 today
- $1000 investment in S&P 500 on January 1st, 2019 = $1,580 today
- $1000 investment in S&P 500 on January 1st, 2020 = $1,220 today
- $1000 investment in S&P 500 on January 1st, 2021 = $1,050 today
- $1000 investment in S&P 500 on January 1st, 2022 = $830 today
- $1000 investment in S&P 500 on January 1st, 2023 = $1,030 today
Taken together, here’s the bottom bottom bottom bottom bottom bottom line for a similar approach with the S&P:
After six $1,000 investments into an S&P 500 index fund in January 2018, 2019, 2020, 2021, 2022, and 2023 my portfolio would be worth $7,190.
That is up +20% since January 2018 compared to a +94% gain of the combined Top Ten Crypto Experiment Portfolios.
Here’s a table providing an overview of the six year ROI comparison between a Top Ten Crypto approach and the S&P:

Conclusion:
To both old-timers and newcomers: thanks so much for taking the time to read and for supporting the Top Ten Crypto Index Fund Experiments. I hope you find the updates helpful in terms of perspective as you navigate the crypto landscape. Be careful out there and don’t put your mental, physical, or financial health at risk chasing gainz. If crypto is causing you to lose sleep at night, chances are you have too much in crypto: try to think long term and don’t invest what you truly can’t afford to lose. Feel free to reach out with any questions and stay tuned for the latest progress reports. A reporting note: I’ll focus on 2023 Top Ten Portfolio reports + one other portfolio on a rotating basis this year, so expect two reports per month. February’s extended report is the 2019 Top Ten Portfolio (the one you’re reading now). You can check out the latest 2018 Top Ten, 2020 Top Ten, 2021 Top Ten, and 2022 Top Ten reports as well.
This article contains affiliate links. If you click on a link in this article, I may earn a small commission at no extra cost to you.
Help keep the lights on at the Top Ten Crypto Index Fund Experiments.
Donate directly:
Bitcoin: bc1qqy4tlwydyrm3sjpyyq88es0cu9j9mdvqer3gwv
Ethereum: 0xC04Bc1996320f27c0A6018cB370c9469a9Dd3a4C
ADA: addr1qywnu55t8hpk4c3jf63tj5xywzej0uhwh7yput4u2z3fq7qa8efgk0wrdt3ryn4zh9gvgu9nylewa0ugrchtc59zjpuqlj6stg
XLM: GA5GJ2JDWC3GB3YXEVRBSR7UBLIB2ROIWZ5FEHML5WXGY5N3PAIDEOEA
Pingback: $1k into the Top 10 Cryptos on January 1st, 2019 (FEB Update/Month 50) +204% – DarkFiberMines.com
Pingback: $1k into the Top 10 Cryptos on January 1st, 2019 (FEB Update/Month 50) +204% - NFT-BOX
Pingback: $1k into the Top 10 Cryptos on January 1st, 2019 (FEB Update/Month 50) +204% -
Pingback: r/CryptoCurrency — $1000 в топ-10 криптовалют на 1 января 2019 г. (обновление FEB/месяц 50) +204% - Отличный обмен