This article contains affiliate links. If you click on a link in this article, I may earn a small commission at no extra cost to you.
Month Thirty Nine – UP 30%
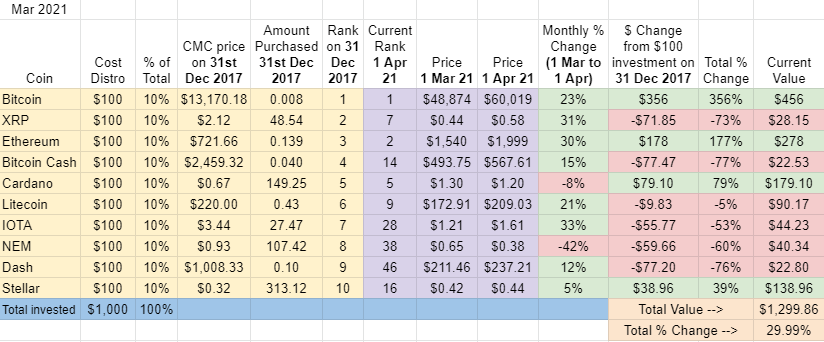
While nowhere near the increase of the past few months, the 2018 Top Ten Portfolio gained a respectable +15% in March. Considering this marks only the second time that the 2018 portfolio has finished a month in positive territory since the Experiment began over three years ago, I’ll take it.
This collection of cryptos is now up a total of +30% since January 2018. For how that compares to the S&P and the other Experiments, see below.
Not that it was a good month for everyone: unlike all-green January and February, we saw some of the 2018 Top Ten coins finish March in the red (I’m looking at you NEM and ADA).
March Ranking, Movement Report, and Dropouts
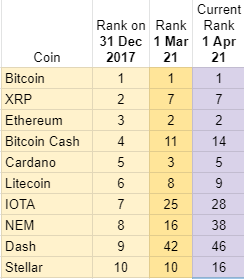
Except for BTC, ETH, and XRP, every crypto slid in the rankings, some with massive falls:
Downs:
- NEM – down twenty-two(!) places (#16→#38)
- Stellar – down six places (#10→#16)
- Dash – down four places (#42→#46)
- Bitcoin Cash – down three places (#11→#14)
- IOTA – down three places (#25→#28)
- ADA – down two places (#3→#5)
- Litecoin – down one place (#8→#9)
Tough March for NEM. As mentioned in past updates, NEM’s ascension probably had something to do with the 1:1 airdrop for Symbol. After the air was dropped, NEM was dropped.
But, as of this update, Dash has fallen the furthest overall, down to #46.
Top Ten dropouts since January 2018: After thirty nine months of the 2018 Top Ten Experiment, 50% of the cryptos that started in the Top Ten have dropped out. NEM, Dash, Stellar, IOTA, and Bitcoin Cash have been replaced by Binance Coin, Tether, LINK, DOT, and newcomer UNI.
Fun fact: Ethereum is the only Top Ten crypto that has climbed in rank since January 2018.
March Winners and Losers
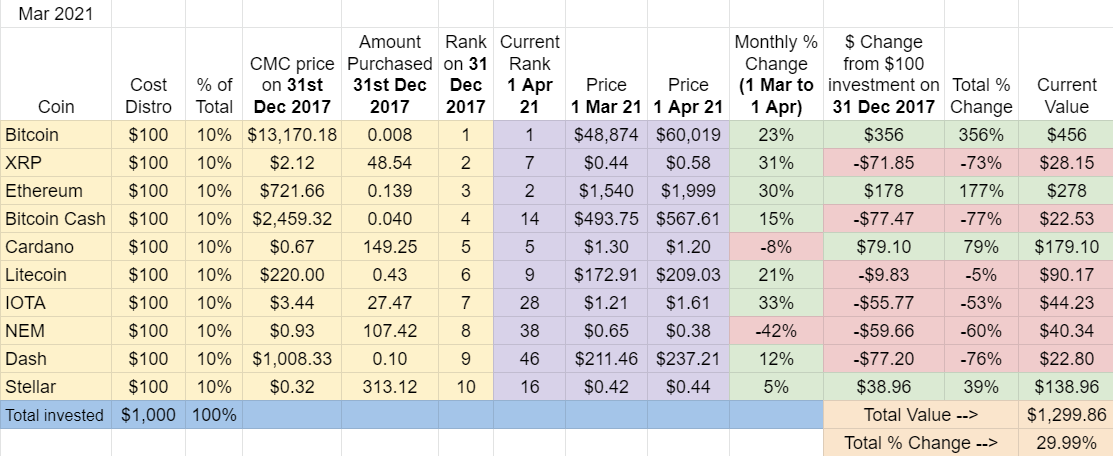
March Winners – Although it slid down three places in the rankings, IOTA’s +33% gain was enough for first place in March, finishing just ahead of XRP, up +31%. It’s been a good couple of months for IOTA: it ended February up +194%.
March Losers – NEM, by a ton, down -42% in one month. ADA was second worst performing, down -8% in March.
Tally of Monthly Winners and Losers
After thirty-nine months, here’s a tally of the monthly winners and losers over the life of the 2018 Top Ten Experiment.
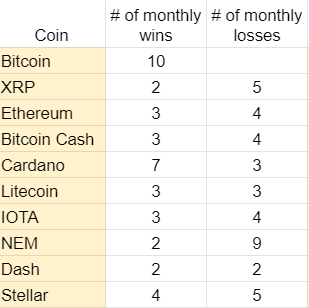
With 10, Bitcoin has the most monthly wins. BTC’s near polar opposite, NEM, has lost 9 months, the most out of the 2018 Top Ten Cryptos.
And Bitcoin is unique as the only cryptocurrency that hasn’t yet lost a month since January 2018, in this or any of the four concurrent Top Ten Experiments (although it has come close a couple of times).
Overall Update – Second straight month in positive territory, 40% of cryptos in green, and LTC approaches break-even.
For the second straight month, I’m happy to report that the 2018 Top Ten Portfolio is in positive territory. This after thirty-seven straight months of the opposite.
At this point in the Experiment, the portfolio as a whole has been dragged upward by four cryptos: BTC, ETH, ADA, and XLM. Litecoin is getting tantalizingly close to break-even point, down only -5% since the beginning of January 2018.
As of this report, Bitcoin is the best performing crypto of the 2018 Top Ten Portfolio. BTC is also leading the 2019 Top Ten cryptos, but not the 2020 or the 2021 cohorts (that would be BNB).
The initial $100 invested in BTC thirty nine months ago is worth $456 today.
The initial $100 invested thirty nine months ago in the worst performing crypto, Bitcoin Cash, is worth $22.53 today. BCH is down -77% since January 2018.
Total Market Cap for the entire cryptocurrency sector:
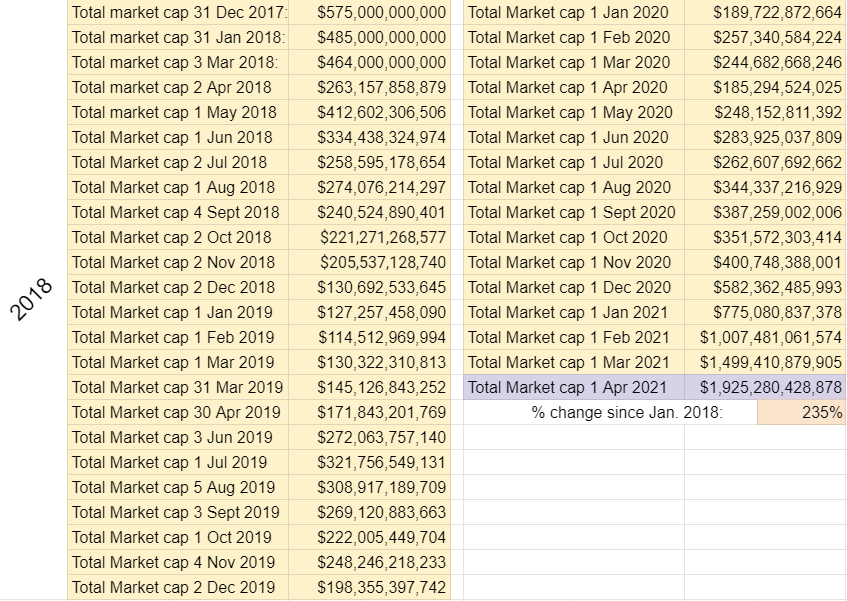
Just two months after finally reaching the $1T milestone, the total crypto market cap is doing some serious flirting with $2T and is up +235% since January 2018. If you were able to capture the entire crypto market since, you’d be doing much better than both the Experiment’s Top Ten approach (+30%) and the S&P (+50%) over the same time period (but not better than just sticking with BTC).
Bitcoin dominance:
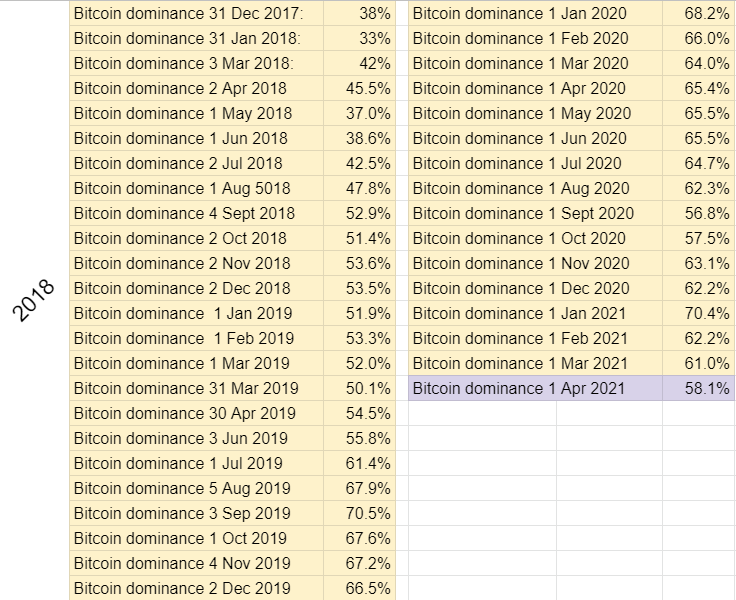
A bit of wobble to report this month with BitDom: it declined from 61% last month to 58% at the end of March. It was over 70% on New Year’s Day. Sign of an Altcoin cycle? Hard to tell, but Bitcoin Dominance is a helpful figure to keep your eye on. The last Altcoin cycle saw BTC dominance go all the way down to a low of 33% way back in the first month of the 2018 Experiment.
Overall return on $1,000 investment since January 1st, 2018:
The 2018 Top Ten Portfolio gained about $150 bucks in March and has now achieved a two month green mini-streak.
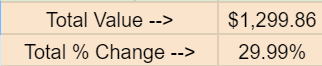
If I decided to cash out the 2018 Top Ten Experiment today, the $1000 initial investment would return $1,300, up +30% from January 2018.
If you’re just joining us, the relatively modest +30% gains have been extremely hard fought. For a taste of how the journey has been, take a look at the ROI over the life of the experiment, month by month:
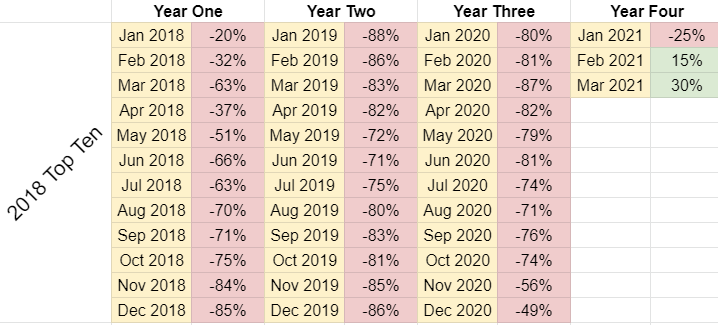
As you can see, this green stuff is still very new and there were many times I was tempted to give up. That said, the 2018 Top Ten portfolio has been rolling and has found itself in an undeniable upward trend since September 2020: March was the sixth straight month of upward portfolio movement, a 2018 Top Ten Index Fund record.
The absolute bottom was back in January 2019 when the 2018 Top Ten Portfolio was down -88% followed closely by the -87% Zombie Apocalypse month (March 2020) just one year ago.
If you’re new and excited about crypto, take a moment to think about being down -88% on your investment after one year, -87% after two years. This is not theory, this is history, and recent history at that. If we’re at the peak of the bull run today, the next few years could look and feel very familiar.
Combining the 2018, 2019, 2020, and 2021 Top Ten Crypto Portfolios
That’s a wrap on the 2018 Top Ten Crypto Portfolio.
After investing another $1000 in the Top Ten in 2019, 2020, and 2021 how are the other Experiments performing?
- 2018 Top Ten Experiment: up +30% (total value $1,300)
- 2019 Top Ten Experiment: up +474% (total value $5,737)
- 2020 Top Ten Experiment: up +589% (total value $6,892)
- 2021 Top Ten Experiment: up +240% (total value $3,399)
So overall? Taking the four portfolios together, here’s the bottom bottom bottom bottom line:
After a $4,000 investment in the 2018, 2019, 2020, and 2021 Top Ten Cryptocurrencies, the combined portfolios are worth $17,328 ($1,300 + $5,737 + $6,892 + $3,399).
That’s up +333% on the combined portfolios.
For an Experiment that often seemed like a very bad idea the first couple of years, things are starting to turn around nicely.
Here’s a table to help visualize:
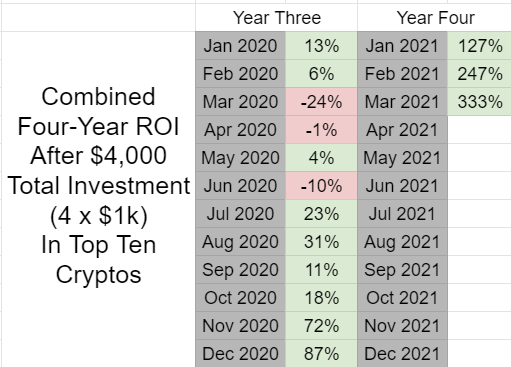
That’s an +333% gain by investing $1k on whichever cryptos happened to be in the Top Ten on January 1st for four straight years.
Top Ten Approach vs. All-In Approach
But surely I would have done even better if I invested the $1k into just one crypto, right?
Definitely…if I made the correct choice! Let’s take a look.
Only five cryptos have begun each of the last four years in the Top Ten: BTC, ETH, XRP, BCH, and LTC. Which one wins?
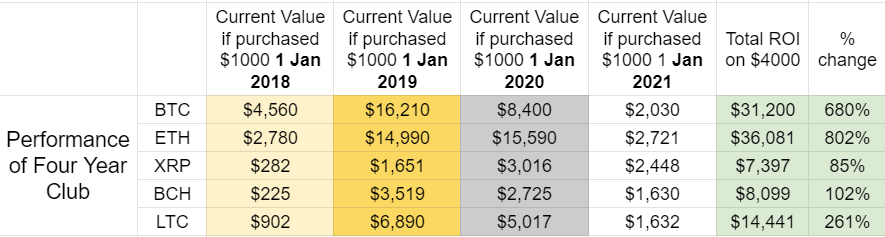
It’s Ethereum by quite a bit: $4,000 into Ethereum in $1k chunks once a year would now be worth $36,081. That’s up +802% and a pretty good argument for dollar cost averaging.
In second place, going all in on Bitcoin with $4,000 USD would have yielded +680%, turning the initial investment into $31,200.
Third place? The Top Ten Portfolio approach, up +333%. Not bad! And about what you’d expect for an Index strategy, falling somewhere between the best and worst performers.
At the bottom? Even though XRP would have been your worst four year all-in bet, this super-slow DCA approach would still be returning +85%, much better than the S&P (see below).
Comparison to S&P 500:
I’m also tracking the S&P 500 as part of the Experiment to have a comparison point with other popular investments options. Yet again, the S&P 500 Index hit a new all time high in March and passed the 4,000 milestone.
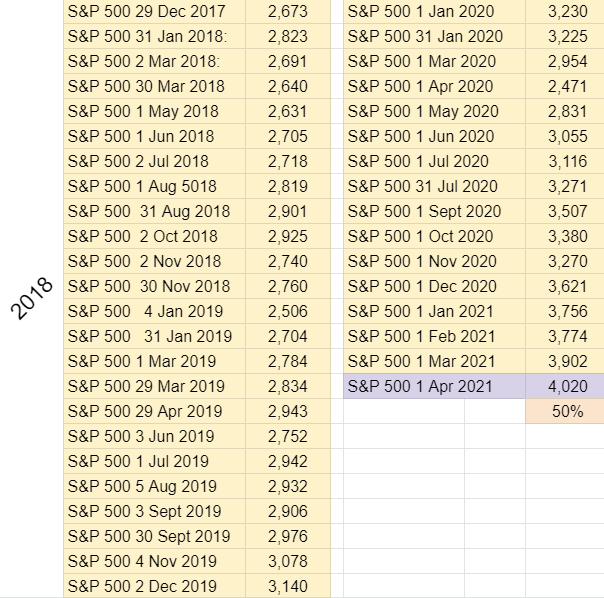
The S&P 500 is up +50% since January 2018, so the initial $1k investment into crypto on January 1st, 2018 would be worth $1500 had it been redirected to the S&P.
But what if I took the same invest-$1,000-on-January-1st-of-each-year approach with the S&P 500 that I’ve been documenting through the Top Ten Crypto Experiments? Here are the numbers:
- $1000 investment in S&P 500 on January 1st, 2018 = $1500 today
- $1000 investment in S&P 500 on January 1st, 2019 = $1600 today
- $1000 investment in S&P 500 on January 1st, 2020 = $1240 today
- $1000 investment in S&P 500 on January 1st, 2021 = $1070 today
Taken together, here’s the bottom bottom bottom bottom line for a similar approach with the S&P:
After four $1,000 investments into an S&P 500 index fund in January 2018, 2019, 2020, and 2021, my portfolio would be worth $5,410 ($1,500 + $1,600 + $1,240 + $1,070)
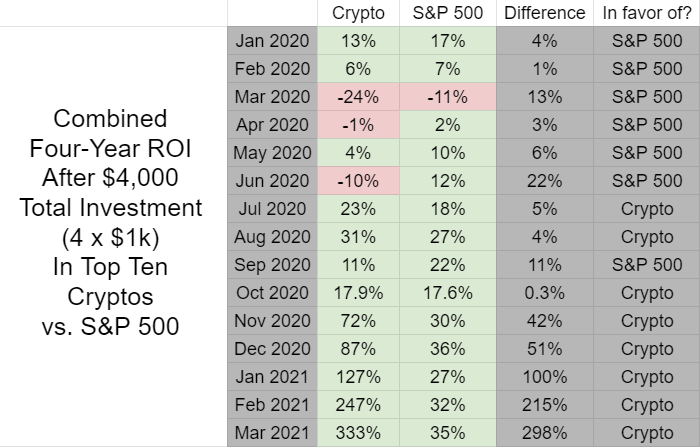
That is up +35% since January 2018 compared to a +333% gain of the combined Top Ten Crypto Experiment Portfolios, a difference of 298% in favor of crypto.
You can compare against five individual coins (BTC, ETH, XRP, BCH, and LTC) by using the table above if you want. The key takeaway? Using a similar investing strategy, the S&P 500 is currently underperforming XRP, Bitcoin Cash, BTC, ETH, LTC and the Top Ten Crypto Portfolio approach.
Here’s a table summarizing the four year ROI comparison between a Top Ten Crypto approach and the S&P as per the rules of the Top Ten Experiments. Check out the growing difference between the S&P and crypto, it’s getting nuts.
In summary:
Stocks: “I’m gonna freak everyone out by reaching a ton of all time highs during a pandemic”
Crypto: “That’s nice. Hold my beer”
Conclusion:
It’s been a crazy ride so far for the 2018 Top Ten. Down -88% at one point, it often seemed unimaginable that one day this group of cryptos would break even, let alone be up by +30%. But here we are, two straight months in the green, six straight months of growth for the portfolio, milestones zooming by.
What’s next? More cryptos in the green would be nice (come on, LTC). I’m also looking forward to the day this homemade index fund of cryptos created as an Experiment by some guy on the internet surpasses the gains of the mighty S&P 500.
To the long-time Experiment followers: thanks so much for reading and for supporting the project over the years.
For those just getting into crypto, welcome! I hope these reports can somehow help you see the highs and lows of what might await you on your crypto adventures. Buckle up, think long term, don’t invest what you can’t afford to lose, and most importantly, enjoy the ride!
Feel free to reach out with any questions and stay tuned for monthly progress reports. Keep an eye out for my parallel projects where I repeat the experiment, purchasing another $1000 ($100 each) of new sets of Top Ten cryptos as of January 1st, 2019, January 1st, 2020, and most recently, January 1st, 2021.
This article contains affiliate links. If you click on a link in this article, I may earn a small commission at no extra cost to you.
Help keep the lights on at the Top Ten Crypto Index Fund Experiments.
Donate directly:
Bitcoin: bc1qqy4tlwydyrm3sjpyyq88es0cu9j9mdvqer3gwv
Ethereum: 0xC04Bc1996320f27c0A6018cB370c9469a9Dd3a4C
ADA: addr1qywnu55t8hpk4c3jf63tj5xywzej0uhwh7yput4u2z3fq7qa8efgk0wrdt3ryn4zh9gvgu9nylewa0ugrchtc59zjpuqlj6stg
XLM: GA5GJ2JDWC3GB3YXEVRBSR7UBLIB2ROIWZ5FEHML5WXGY5N3PAIDEOEA
Pingback: I bought $1k of the Top 10 Cryptos on January 1st, 2018 (MAY Update/Month 41)
Pingback: I bought $1k of the Top 10 Cryptos on January 1st, 2018 (MAY Update/Month 41) – DarkFiberMines.com
Pingback: I bought $1k of the Top 10 Cryptos on January 1st, 2018 (March Update/Month 39) – DarkFiberMines.com
Pingback: I bought $1k of the Top 10 Cryptos on January 1st, 2018 (March Update/Month 39) : CryptoCurrency - Go Coin It
Pingback: I bought $1k of the Top 10 Cryptos on January 1st, 2018 (March Update/Month 39) - Folks Library News