This article contains affiliate links. If you click on a link in this article, I may earn a small commission at no extra cost to you.
Ways to pick up free Bitcoin:
Method #1: Open an Uphold wallet using this link. Buy or sell $250 in crypto in the first 30 days, get $20 in free BTC.
Method #2: Sign up for Nexo using this link. Top up your account with $500 in crypto and complete a few tasks. Make sure your assets are still worth $500 in 30 days and you will receive $35 in free BTC.
Method #3: Open a Coinbase account using this link. Buy $20 in crypto, get $20 in free BTC.
Happy HODLING!
Month Twelve – UP 292%
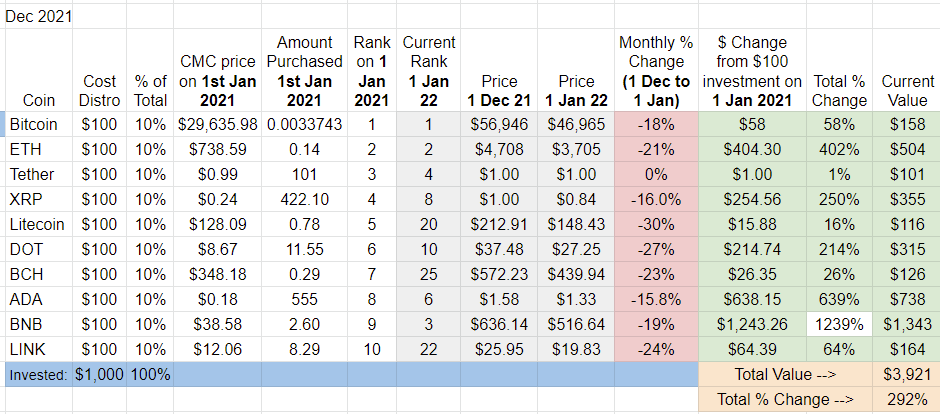
The 2021 Top Ten Crypto Index Fund consists of: BTC, ETH, USDT, XRP, Litecoin, DOT, BCH, ADA, BNB, and LINK.
December highlights for the 2021 Top Ten Portfolio:
- Every crypto in the 2021 in the red
- BNB continues to maintain a strong overall lead
- After one year, 2021 Top Ten Portfolio is up +292%
December Ranking and Dropout Report

Top Ten dropouts since January 2021: one year into the 2021 Top Ten Experiment, three cryptos have dropped out: Chainlink, Litecoin, and Bitcoin Cash. They have been replaced by SOL, Luna, and USDC.
December Winners and Losers
December Winners – None, unless you count USDT
December Losers – Litecoin completed a rare clean sweep this month: it was the worst performer in each of the four Experiments, down -30% in December. DOT (-27%) was the second worst performer this month.
Tally of Monthly Winners and Losers
One year into the Experiment, here’s where we stand in terms of the 2021 Top Ten Portfolio’s monthly winners and losers:
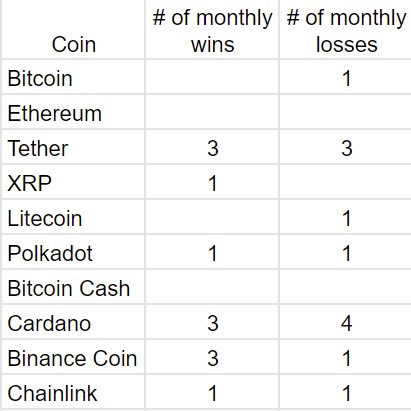
ADA, BNB, and USDT are in a three way tie for most monthly victories. ADA has the most monthly losses.
One Year Update – BNB easily outperforms, all cryptos in green, Litecoin turns in the worst performance
After a year of back and forth between BNB and ADA, Binance Coin has left Cardano and the rest of the cryptos in this portfolio well behind.
The $100 investment into first place BNB one year ago is now worth $1,343.
Besides Tether, Litecoin turned in the worst performance of the 2021 Top Ten Portfolio, up +16% in 2021.
Total Market Cap for the Entire Cryptocurrency Sector:
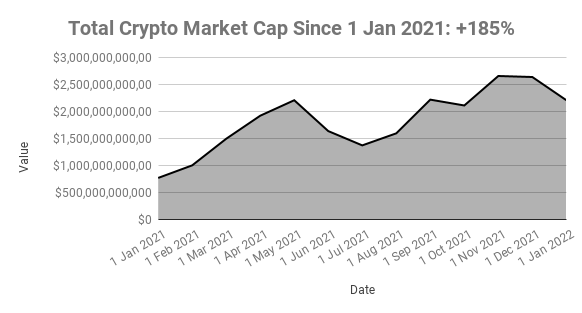
As a sector, crypto is up +185% in the year lifespan of the 2021 Top Ten Experiment.
You may notice that the 2021 Top Ten Portfolio has produced better returns than the overall crypto market cap (+292% vs. +185%) so far in 2021.
This is a bit of an outlier and the gap is closing: the rest of the Top Ten Experiments are well behind over their respective time frames. Here are the latest figures:
Buying the Top Ten at equal weight in Jan 2018: Up +34% vs. +285% for the total crypto market cap.
Starting in Jan 2019? +504% for the Top Ten vs. +1,638% for the total market cap.
Starting in Jan 2020? +795% for the Top Ten vs. +1,066% for the total Market Cap.
Although the 2021 Top Ten approach has held up quite well compared to the overall market so far, I expect to see it fall behind eventually, like the other experiments.
Crypto Market Cap Low Point in the 2021 Top Ten Crypto Index Experiment: $775B in January 2021.
Crypto Market Cap High Point in the 2021 Top Ten Crypto Index Experiment: $2.6T in October.
Bitcoin Dominance:

BitDom fell in December, ending the month at 40.2%. This is a new low for the 2021 Experiment.
BitDom Low Point in the 2021 Top Ten Crypto Index Experiment: 40.2% this month.
BitDom High Point in the 2021 Top Ten Crypto Index Experiment: 70.4% in January 2021.
Overall return on $1,000 investment since January 1st, 2021:
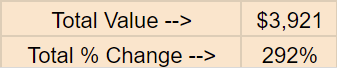
The 2021 Portfolio dropped $945 in December. Overall, the 2021 Top Ten Portfolio is up +292%. The initial $1000 investment one year ago, on New Year’s Day 2021, is worth $3,921.
Here’s the month by month ROI of the 2021 Top Ten Experiment, to give you a sense of perspective as we go along:
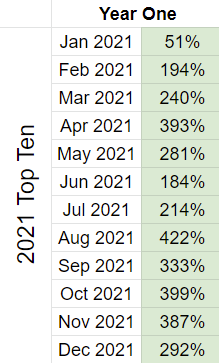
The 2021 Top Ten Portfolio has had the best start, by far, of any of the four Top Ten Crypto Experiments.
Combining the 2018, 2019, 2020, and 2021 Top Ten Crypto Portfolios
As most readers are aware, this is the fourth year of an Experiment I started back in January of 2018, at the height of the last crypto bull run. Where do we stand if we combine four years of the Top Ten Crypto Index Fund Experiments?
- 2018 Top Ten Experiment: up +34% (total value $1,341)
- 2019 Top Ten Experiment: up +504% (total value $6,044)
- 2020 Top Ten Experiment: up +795% (total value $8,951)
- 2021 Top Ten Experiment: up +292% (total value $3,921)
So overall? Taking the four portfolios together, here’s the bottom bottom bottom bottom line:
After a $4,000 investment in the 2018, 2019, 2020, and 2021 Top Ten Cryptocurrencies, the combined portfolios are worth $20,257 ($1,341 + $6,044 + $8,951 + $3,921).
That’s up +406% on the combined portfolios, down from last month’s all time high for the Top Ten Index Fund Experiments.
Here’s a table to help visualize the progress of the combined portfolios:
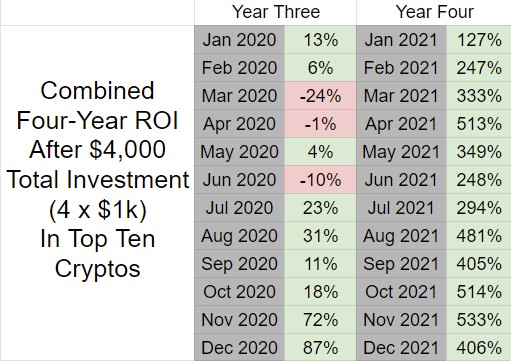
In summary: That’s a +406% gain by investing $1k on whichever cryptos happened to be in the Top Ten on January 1st (including stablecoins) for four straight years.
Comparison to S&P 500
I’m also tracking the S&P 500 as part of my experiment to have a comparison point to traditional markets
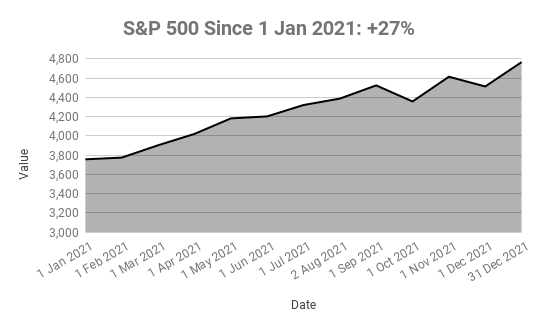
The S&P 500 Index is up 27% in 2021. The initial $1k investment I put into crypto one year ago would be worth $1,270 had it been redirected to the S&P 500.
The 2021 Top Ten Crypto Portfolio is up +292% over the same time period – the initial $1k investment in crypto one year ago is now worth $3,921.
That’s a difference of $2,651 on a $1k investment in one year.
What about in the longer term? What if I invested in the S&P 500 the same way I did during the first four years of the Top Top Crypto Index Fund Experiments? What I like to call the world’s slowest dollar cost averaging method? Here are the figures:
- $1000 investment in S&P 500 on January 1st, 2018 = $1,780 today
- $1000 investment in S&P 500 on January 1st, 2019 = $1,900 today
- $1000 investment in S&P 500 on January 1st, 2020 = $1,480 today
- $1000 investment in S&P 500 on January 1st, 2021 = $1,270 today
Taken together, here’s the bottom bottom bottom bottom line for a similar approach with the S&P:
After four $1,000 investments into an S&P 500 index fund in January 2018, 2019, 2020, and 2021, my portfolio would be worth $6,430 ($1,780 + $1,900 + $1,480 + $1,270).
That is up +61% since January 2018 compared to a +406% gain of the combined Top Ten Crypto Experiment Portfolios.
To help provide perspective, here’s fancy new chart showing the combined four year ROI for the Crypto Top Ten Experiment vs. the S&P up to this point

Conclusion:
To the long time followers of the Top Ten Experiments, thank you so much for sticking around so long. For those just getting into crypto, I hope these reports will help prepare you for the highs and lows that await on your crypto adventures. Buckle up, go with the flow, think long term, don’t invest what you can’t afford to lose, and most importantly, try to enjoy the ride!
Feel free to reach out with any questions and stay tuned for progress reports. Keep an eye out for my parallel projects tracking the Top Ten cryptos as of January 1st, 2018 (the OG Experiment), January 1st, 2019, January 1st, 2020, and most recently, January 1st, 2022.
This article contains affiliate links. If you click on a link in this article, I may earn a small commission at no extra cost to you.
Help keep the lights on at the Top Ten Crypto Index Fund Experiments.
Donate directly:
Bitcoin: bc1qqy4tlwydyrm3sjpyyq88es0cu9j9mdvqer3gwv
Ethereum: 0xC04Bc1996320f27c0A6018cB370c9469a9Dd3a4C
ADA: addr1qywnu55t8hpk4c3jf63tj5xywzej0uhwh7yput4u2z3fq7qa8efgk0wrdt3ryn4zh9gvgu9nylewa0ugrchtc59zjpuqlj6stg
XLM: GA5GJ2JDWC3GB3YXEVRBSR7UBLIB2ROIWZ5FEHML5WXGY5N3PAIDEOEA
Pingback: $1k invested into the Top Ten Cryptos in January 2021 - ONE YEAR REPORT (UP +292%) - NFT-BOX
Pingback: $1k invested into the Top Ten Cryptos in January 2021 - ONE YEAR REPORT (UP +292%) - WORK 4 BTC
Pingback: Портфель Криптовалют на 2022 года инвестиционный – Портал TradeLikeaPro
Pingback: $1k invested into the Top 10 Cryptos on January 1st, 2020 Up +795% (TWO YEAR REPORT): CryptoCurrency - R1 NEWS
Pingback: $1k into the Top 10 Cryptos on January 1st, 2019 (THREE YEAR REPORT) +504% – WORK 4 BTC
Pingback: I bought $1k of the Top 10 Cryptos on January 1st, 2018 (FOUR YEAR REPORT) - Crypto Basset Hound
Pingback: J'ai acheté 1 000 $ du Top 10 des cryptos le 1er janvier 2018 (RAPPORT DE QUATRE ANS) : CryptoCurrency - R1 NEWS