Month Twenty Eight – UP 653%

The 2019 Top Ten Portfolio followed a strong March with an even stronger April: it gained about 175% this month. Only one crypto finished in the red (Bitcoin) and XRP easily outperformed its peers. This portfolio continues to be the second best performing of the four, trailing the first place 2020 Top Ten Portfolio by 300%.
April Movement Report, Ranking, and Dropouts
Here are the ups and downs this month for the 2019 Top Ten Portfolio:
Ups:
- XRP – up three places (#7→#4)
- Bitcoin Cash – up four places (#14→#10) and back in the Top Ten
- BSV – up one place (#29→#28)
Downs:
- EOS – down two places (#24→#26)
- Litecoin – down two places (#9→11)
- Tether – down one place (#4→#5)

Top Ten dropouts since January 2019: After twenty-eight months of the 2019 Top Ten Experiment 50% of the cryptos that started in the Top Ten have dropped out. EOS, Litecoin, BSV, Stellar, and Tron have been replaced by Binance Coin, Doge, Cardano, UNI, and Polkadot.
BSV and EOS are the only 2019 Top Ten cryptos that have dropped out of the Top Twenty.
April Winners and Losers
April Winners – It wasn’t really close this month: XRP easily outpaced its peers, up +172l. Bitcoin Cash finished in second place in April, up +72%.
April Losers – Here’s something you don’t see everyday: Bitcoin had the worst performance of the month. Since all other cryptos were well in the green, Tether is the second worst performer of April.
Tally of Monthly Winners and Losers
Which crypto holds the most wins or losses over the life of the project? Here’s a snapshot of the winners and losers over the first twenty-eight months of the 2019 Top Ten Experiment:

Tether still has the greatest number of monthly victories (7) followed by BTC with five. This tells us 25% of the time (i.e. seven times out of twenty eight months) every crypto in the 2019 Top Ten Portfolio has finished the month in the red (although many of UST’s victories happened in 2019).
April marks the first time that BTC has finished a month at the bottom of any of the four Top Ten Portfolios. This makes EOS the only crypto without a monthly loss in the 2019 Top Ten Experiment.
Overall Update – BTC gives up lead to ETH, all cryptos well in the green, EOS worst performing
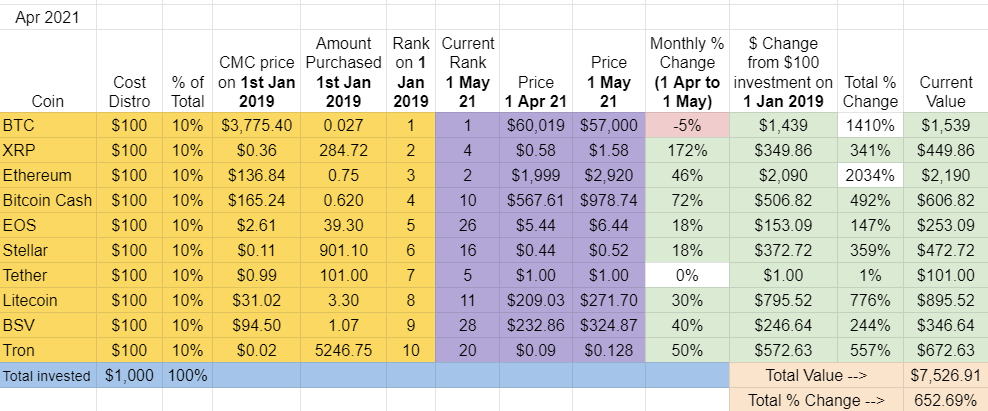
April saw Bitcoin’s lead evaporate completely. Ethereum not only caught BTC this month, but established a substantial +600% lead.
And that $100 investment into first place ETH on January 1st, 2019? It’s currently worth $2,190.
After twenty eight months 100% of the cryptos in the 2019 Top Ten Portfolio are either flat or in positive territory. Not counting stablecoin Tether, the worst performing crypto is EOS, which is still up +147% in a little over two years. Compare that to the ROI of the S&P (see below).
Although the 2019 Top Ten Portfolio is up +653%, April saw it fall even further behind the Experiment’s top performing Portfolio, the 2020 Top Ten’s massive +952% gain.
Total Market Cap for the Entire Cryptocurrency Sector:
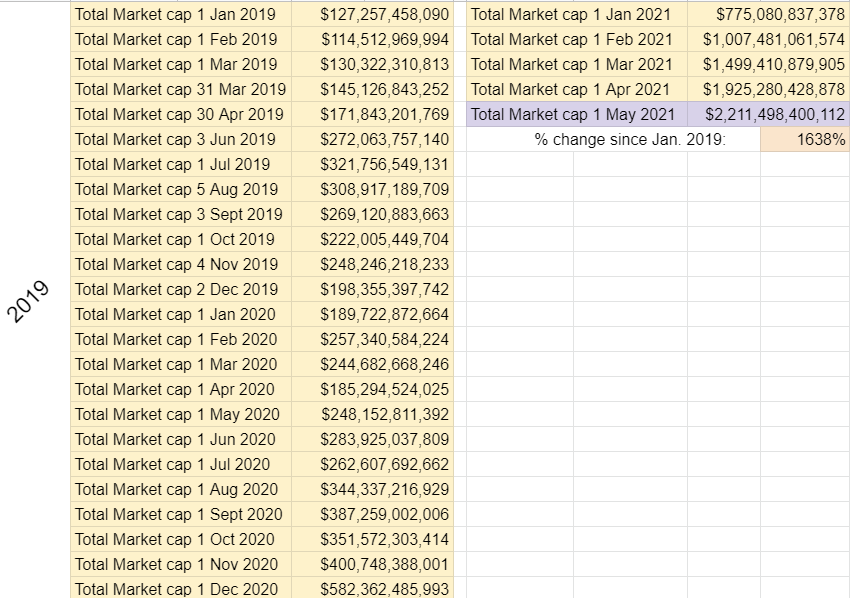
Although the Top Ten Portfolios are starting to generate a nice ROI, it’s nothing compared to the overall market cap. If you were able to somehow capture the entire cryptocurrency sector since January 2019, your ROI would be +1638%. That’s still a bit behind first place ETH, but much better than the rest of the cryptos and much better than the Top Ten approach.
After reaching the $1T milestone in February, we’re at $2T just a few months later. We also have a nice seven month streak of month-ending total market cap record highs going.
Bitcoin Dominance:
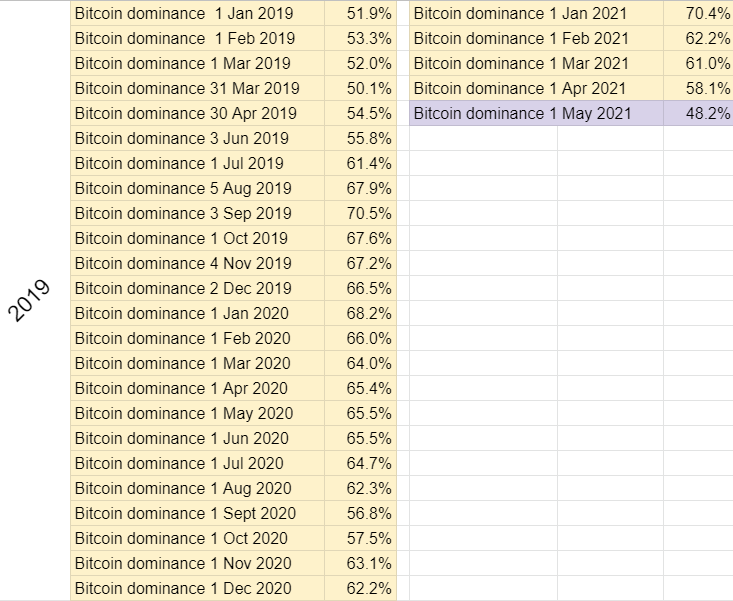
BitDom plummeted in April and is now at the lowest point in the history of the 2019 Top Ten Index Fund Experiment. For context, the table above shows the progression over the last twenty eight months with BTC domination ranging between 48%-70%.
For what happened last time Bitcoin Dominance fell into the low 40s and 30s, check out the 2018 Top Ten Experiment.
Overall return on $1,000 investment since January 1st, 2019:

The 2019 Top Ten Cryptos Portfolio gained almost $1800 in April. After twenty-eight months the value of the initial $1000 investment is $7,527, up +653%. That makes six straight months of record returns for the 2019 Portfolio.
Here’s a table summarizing the monthly ROI over the life of the 2019 Top Ten Index Fund experiment, which provides a pretty good sense of the journey to this point:
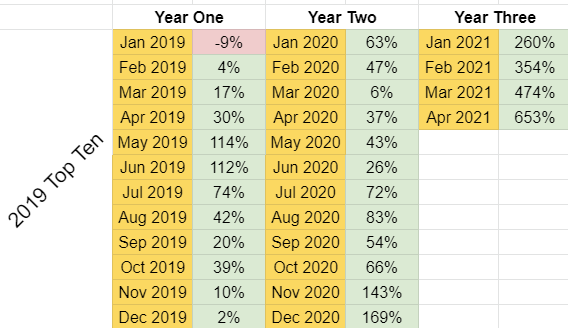
Mostly green, but still with its share of significant dips. For example, a little over one year ago the 2019 Top Ten Portfolio was up only +6%.
At +653%, the 2019 Top Ten Portfolio is the second best performing out of the four Experiments. First place is the 2020 group, which has pulled well ahead of the pack, now up +952%.
Over the years, it’s been back and forth between the 2019 and 2020 Top Ten Portfolios, but the last couple months have seen the 2020 Top Ten pull farther and farther ahead: it is now holding an almost 300 percentage point lead over the second place 2019 Portfolio.
Combining the 2018, 2019, 2020, and 2021 Top Ten Crypto Portfolios
Speaking of other Top Ten Portfolios, let’s put them all together now:
- 2018 Top Ten Experiment: up +56% (total value $1,556)
- 2019 Top Ten Experiment: up +653% (total value $7,527)
- 2020 Top Ten Experiment: up +952% (total value $10,522)
- 2021 Top Ten Experiment: up +393% (total value $4,927)
Taking the four portfolios together, here’s the bottom bottom bottom bottom line:
After a $4,000 investment in the 2018, 2019, 2020, and 2021 Top Ten Cryptocurrencies, the combined portfolios are worth $24,532 ($1,556 + $7,527 + $10,522 + $4,927).
That’s up +513% on the combined portfolios, another record high for the Top Ten Index Fund Experiment project.
Here’s a table to help visualize the progress of the combined portfolios:
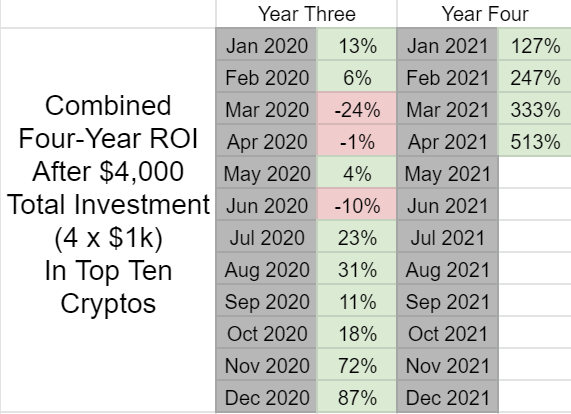
In summary: That’s an +513% gain by investing $1k on whichever cryptos happened to be in the Top Ten on January 1st for four straight years.
Top Ten Index vs. Top Five Index
Inspired by a suggestion from one of our blog readers, let’s take a look at how the 2019 Top Ten approach would compare to a hypothetical Top Five Index.
A Top Five 2019 Index would mean investing $200 into BTC, XRP, ETH, BCH, and EOS.

After twenty eight months, a Top Five Index would be worth $10,077, returning 908%. That’s compared to the $7,527 (+653%) of the 2019 Top Ten.
So at this point in the 2019 Experiment, going with the five largest caps at the time would have been the better approach, by far.
Alright, that’s crypto. How does crypto compare to the stock market?
Comparison to S&P 500:
I’m also tracking the S&P 500 as part of the experiments to have a comparison point with traditional markets. Another month, another all time high for the S&P:

Since the S&P 500 Index is up 67% since January 2019, the initial $1k investment I put into crypto a little over two years ago would be worth $1,670 had it been redirected to the S&P 500 in January 2019.
Even though an extremely solid return for traditional markets, that +67% return is nearly six hundred percentage points behind the return of the 2019 Top Ten Portfolio over the same time period.
But what if I took the same world’s-slowest-dollar-cost-averaging $1,000-per-year-on-January-1st-Crypto-Index-Fund-Experiment approach with the S&P 500? It would yield the following:
- $1000 investment in S&P 500 on January 1st, 2018 = $1564 today
- $1000 investment in S&P 500 on January 1st, 2019 = $1670 today
- $1000 investment in S&P 500 on January 1st, 2020 = $1290 today
- $1000 investment in S&P 500 on January 1st, 2021 = $1110 today
Taken together, here’s the bottom bottom bottom bottom line for a similar approach with the S&P:
After four $1,000 investments into an S&P 500 index fund in January 2018, 2019, 2020, and 2021, my portfolio would be worth $5,634 ($1,564 + $1,670 + $1,290 + $1,110)
That is up +41% since January 2018 compared to a +513% gain of the combined Top Ten Crypto Experiment Portfolios, a difference of 472% in favor of crypto.
Here’s a table providing an overview of the four year ROI comparison between a Top Ten Crypto approach and the S&P:
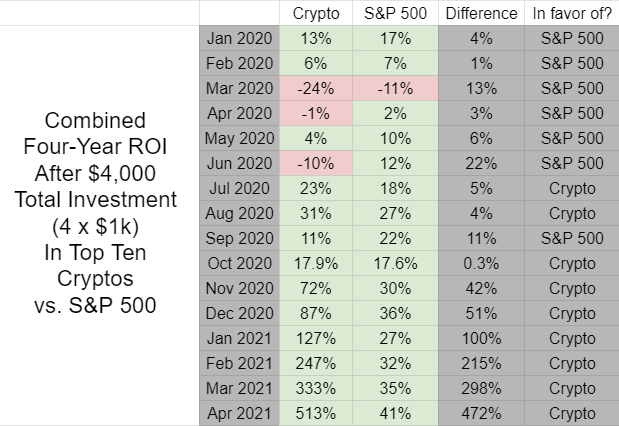
The 472% difference is by far the largest gap since I began tracking this metric in early 2020, even with stocks at all time highs.
Conclusion:
With Bitcoin first monthly loss and BitDom at a 2019 Top Ten Experiment low, it’s starting to feel a bit dangerous. Will the crypto market go through the same BTC run up, altcoin run up, total market crash as 2017/2018 or is this time different?
To both old-timers and newcomers: thanks so much for taking the time to read and for supporting the Top Ten Crypto Index Fund Experiments. I hope you find the updates helpful in terms of perspective as you navigate this strange and exciting crypto landscape.
Feel free to reach out with any questions and stay tuned for progress reports. Keep an eye out for my parallel projects tracking the Top Ten cryptos as of January 1st, 2018 (the OG experiment), January 1st, 2020, and most recently, January 1st, 2021.
In the meantime, think long term, don’t invest what you can’t afford to lose, buckle up, and enjoy the ride!
This article contains affiliate links. If you click on a link in this article, I may earn a small commission at no extra cost to you.
Help keep the lights on at the Top Ten Crypto Index Fund Experiments.
Donate directly:
Bitcoin: bc1qqy4tlwydyrm3sjpyyq88es0cu9j9mdvqer3gwv
Ethereum: 0xC04Bc1996320f27c0A6018cB370c9469a9Dd3a4C
ADA: addr1qywnu55t8hpk4c3jf63tj5xywzej0uhwh7yput4u2z3fq7qa8efgk0wrdt3ryn4zh9gvgu9nylewa0ugrchtc59zjpuqlj6stg
XLM: GA5GJ2JDWC3GB3YXEVRBSR7UBLIB2ROIWZ5FEHML5WXGY5N3PAIDEOEA
Pingback: Tracking 2020 Top Ten Cryptocurrencies – Month Sixteen -
Pingback: $1k invested into the Top 10 Cryptos on January 1st, 2020 Up +952% (April Update – Month 16) – DarkFiberMines.com
Pingback: $1k invested into the Top 10 Cryptos on January 1st, 2020 Up +952% (April Update - Month 16) - Folks Library News
Pingback: I bought $1k of the Top 10 Cryptos on January 1st, 2019 (April Update/Month 28)
Pingback: I bought $1k of the Top 10 Cryptos on January 1st, 2019 (April Update/Month 28) – DarkFiberMines.com
Pingback: I bought $1k of the Top 10 Cryptos on January 1st, 2019 (April Update/Month 28) - Folks Library News