This article contains affiliate links. If you click on a link in this article, I may earn a small commission at no extra cost to you.
Ways to pick up free Bitcoin:
Method #1: Open an Uphold wallet using this link. Buy or sell $250 in crypto in the first 30 days, get $20 in free BTC.
Method #2: Sign up for Nexo using this link. Top up your account with $500 in crypto and complete a few tasks. Make sure your assets are still worth $500 in 30 days and you will receive $35 in free BTC.
Method #3: Open a Coinbase account using this link. Buy $20 in crypto, get $20 in free BTC.
Happy HODLING!
Month Fifty-Three – Down -32%
The 2018 Top Ten Crypto Index Fund Portfolio is BTC, XRP, ETH, BCH, ADA, LTC, IOTA, NEM, Dash, and Stellar.
May highlights for the 2018 Top Ten Portfolio:
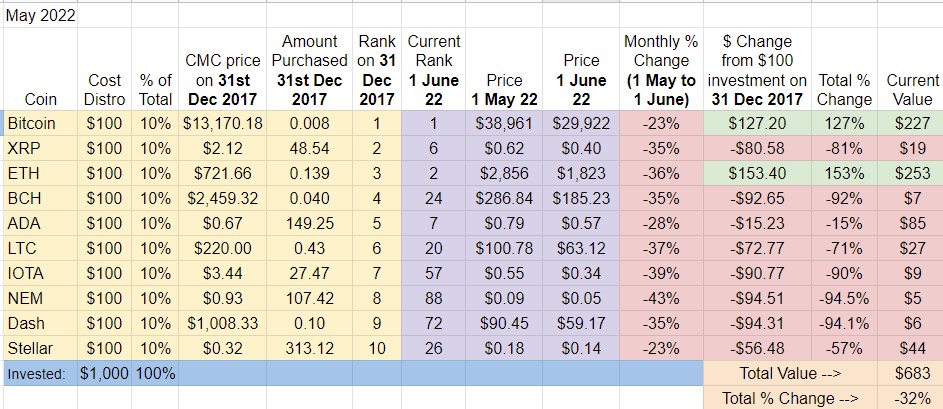
- Second all red month in a row. Bitcoin and Stellar (both -23%%) fell the least.
- ETH maintains the overall lead, with BTC in second place. Only these two cryptos are in the green since January 2018.
- The 2018 Portfolio drops to -32%, a level not seen since January 2021.
May Ranking and Dropouts
Here’s a look at the movement in the ranks since January 2018:
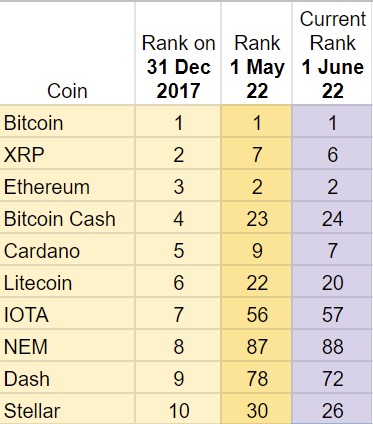
Top Ten dropouts since January 2018: Fifty-three months into the 2018 Top Ten Experiment, only 40% of the cryptos that started in the Top Ten have remained. NEM, Dash, Stellar, Bitcoin Cash, IOTA, and Litecoin have been replaced by Tether, BNB, SOL, USDC, BUSD, and DOGE.
Although some of these older cryptos have held their positions fairly well despite the recent downturn, NEM still looks like it might be the first of the 2018 Top Ten to drop out of the Top 100.
Until this month, NEM was the lowest ranked crypto of any of the five Experiments, but, thanks to the May Terra meltdown, that honor now belongs to LUNA (see the latest 2022 Top Ten Update for all the gruesome details).
May Winners and Losers
May Winners – 100% red month, but Bitcoin and XLM dropped the least, ending May down -23%.
May Losers – NEM, dropping -43% this month.
Overall Update – ETH in first place, but second place BTC gains ground. NEM in last place, Portfolio back to Jan. 2021 levels
After reaching an All Time High (+72%) in October 2021, the 2018 Top Ten Portfolio has continued to lose value. Currently, it is down -32%, levels not seen since January 2021.
After nearly four and a half years of holding these cryptos, only 2 out of the 10 cryptos are in the green: BTC and ETH.
Overall, first place ETH (+153%) is ahead of second place BTC (+127%), but the gap has been closing in recent months.
The initial $100 invested in first place ETH four and a half years ago? It’s worth $253 today.
NEM is at the bottom, down nearly -95% since January 2018. The initial $100 invested in NEM fifty-three months ago is worth about $5 today.
Total Market Cap for the entire cryptocurrency sector:
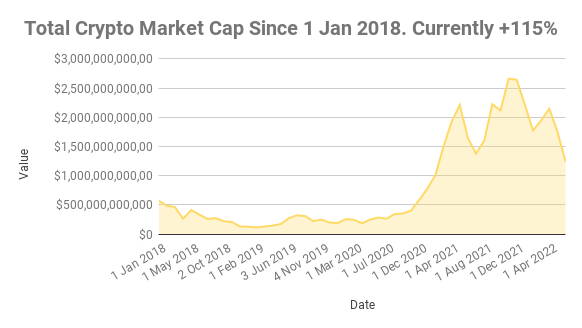
End of May 2022 market cap: $1,237,646,071,341
Crypto as a sector is up +115% since January 2018. There was no easy way to achieve this at the time, but if you were able to capture the entire crypto market since New Year’s Day 2018, you’d be doing much, much better than the Experiment’s Top Ten approach (-32%). You also would have more than doubled the return of the S&P (+53%) over the same period of time, and eight of the individual cryptos within the 2018 Top Ten (except for Ethereum and Bitcoin).
Crypto Market Cap Low Point in the 2018 Top Ten Crypto Index Experiment: $114B in January 2019.
Crypto Market Cap High Point in the 2018 Top Ten Crypto Index Experiment: $2.65T in October 2021.
Bitcoin dominance:
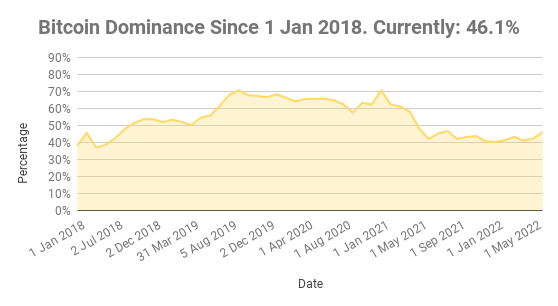
BitDom ticked up in May ending the month at 46.1%. When considering the entire four and a half year 2018 Experiment time frame, BTC dominance is near the low end. For context:
Low Point in the 2018 Top Ten Crypto Index Experiment: 33% in January 2018.
High Point in the 2018 Top Ten Crypto Index Experiment: 70.5% in August 2019.
Overall return on $1,000 investment since January 1st, 2018:
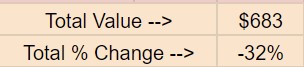
If I decided to cash out the 2018 Top Ten Experiment today, the $1000 initial investment would be worth $683, -32% from January 2018.
After a streak of more than a year in (or very near) positive territory, the 2018 portfolio is back on familiar red ground. For context, in fifty-three months since the start of the 2018 Index Fund Experiment, forty months have been in the red, with only thirteen months of green, all which occurred in 2021/22.
Here’s a look at the ROI over the life of the experiment, month by month, since the beginning of the 2018 Experiment nearly 4.5 years ago:

The all time high for this portfolio is October 2021 (+72%). The lowest point was in January 2019 when the 2018 Top Ten Portfolio was down -88%.
A reminder: no one can predict the value of any crypto tomorrow, let alone next month or next year. The 2018 Top Ten Crypto Portfolio was down -88% after one year, -80% after two years, -25% after three years.
Combining the 2018, 2019, 2020, 2021, and 2022 Top Ten Crypto Portfolios
Alright, that’s that for the 2018 Top Ten Crypto Index Fund Experiment recap.
But I didn’t stop the Experiment in 2018: I invested another $1000 into each of the 2019, 2020, 2021, and 2022 Top Tens as well. How are the other Crypto Index Fund Experiments doing?
- 2018 Top Ten Experiment: down -32% (total value $683)
- 2019 Top Ten Experiment: up +238% (total value $3,376)
- 2020 Top Ten Experiment: up +381% (total value $4,808) (best performing portfolio)
- 2021 Top Ten Experiment: up +99% (total value $$1,991)
- 2022 Top Ten Experiment: down -66% (total value $342)
So overall? Taking the five portfolios together, here’s the bottom bottom bottom bottom bottom line:
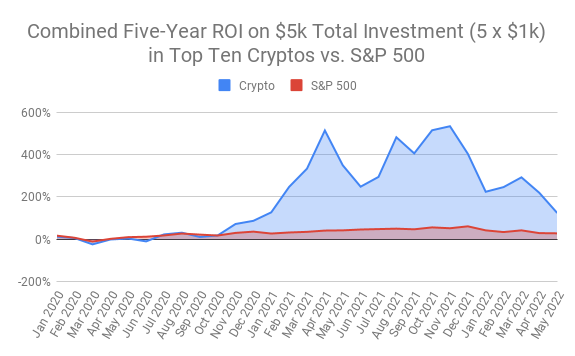
After a $5,000 total investment in the 2018, 2019, 2020, 2021, and 2022 Top Ten Cryptocurrencies, the combined portfolios are worth $11,200.
That’s up +124% on the combined portfolios, down from November’s all time high of +553% for the combined Top Ten Index Fund Experiments. Here’s the combined monthly ROI since I started tracking the metric in January 2020:
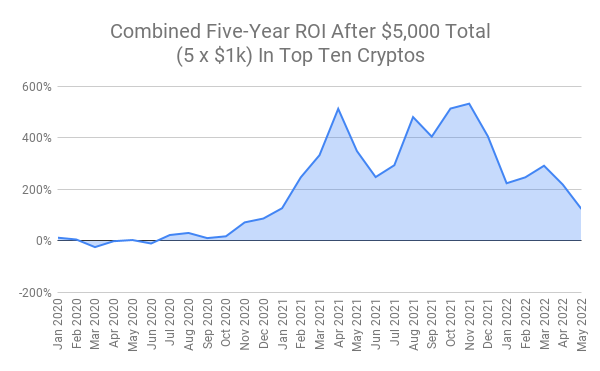
That’s a +124% gain by investing $1k in whichever cryptos happened to be in the Top Ten on January 1st (including stablecoins) for five years in a row.
Comparison to S&P 500:
I’m also tracking the S&P 500 as part of the Experiment to have a comparison point with other popular investments options.
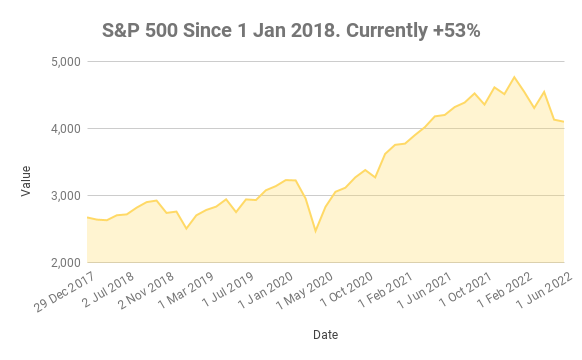
The S&P 500 is up +53% since January 2018, so the initial $1k investment into crypto on January 1st, 2018 would be worth $1,530 had it been redirected to the S&P.
Taking the same invest-$1,000-on-January-1st-of-each-year approach with the S&P 500 that I’ve been documenting through the Top Ten Crypto Experiments, the yields are the following:
- $1000 investment in S&P 500 on January 1st, 2018 = $1,530 today
- $1000 investment in S&P 500 on January 1st, 2019 = $1,640 today
- $1000 investment in S&P 500 on January 1st, 2020 = $1,270 today
- $1000 investment in S&P 500 on January 1st, 2021 = $1,090 today
- $1000 investment in S&P 500 on January 1st, 2022 = $860 today
Taken together, here’s the bottom bottom bottom bottom bottom line for a similar approach with the S&P:
After five $1,000 investments into an S&P 500 index fund in January 2018, 2019, 2020, 2021, and 2022 my portfolio would be worth $6,390.
That is up +28% since January 2018 compared to a +124% gain of the combined Top Ten Crypto Experiment Portfolios.
Here’s a fancy new chart showing the four year ROI comparison between a Top Ten Crypto approach and the S&P as per the rules of the Top Ten Experiments:
Conclusion:
Many thanks to the long-time Experiment followers, appreciate you taking the time to follow along over the years. For those just getting into crypto, welcome! I hope these reports can somehow give you a taste of what you may be in for as you begin your crypto adventures. Buckle up, think long term, don’t invest what you can’t afford to lose, and try to enjoy the ride!
A reporting note: I’ll focus on 2022 Top Ten Portfolio reports + one other portfolio on a rotating basis this year, so expect only two reports per month. May’s extended report is on the 2018 Top Ten Portfolio (the OG Experiment), which you’re reading now. You can check out the latest 2019 Top Ten, 2020 Top Ten, 2021 Top Ten, and 2022 Top Ten reports as well.
This article contains affiliate links. If you click on a link in this article, I may earn a small commission at no extra cost to you.
Help keep the lights on at the Top Ten Crypto Index Fund Experiments.
Donate directly:
Bitcoin: bc1qqy4tlwydyrm3sjpyyq88es0cu9j9mdvqer3gwv
Ethereum: 0xC04Bc1996320f27c0A6018cB370c9469a9Dd3a4C
ADA: addr1qywnu55t8hpk4c3jf63tj5xywzej0uhwh7yput4u2z3fq7qa8efgk0wrdt3ryn4zh9gvgu9nylewa0ugrchtc59zjpuqlj6stg
XLM: GA5GJ2JDWC3GB3YXEVRBSR7UBLIB2ROIWZ5FEHML5WXGY5N3PAIDEOEA
Pingback: I bought $1k of the Top 10 Cryptos on January 1st, 2023 (NOV Update/Month 11/+39%) - NFT-BOX