
Month Sixteen – Down 82%
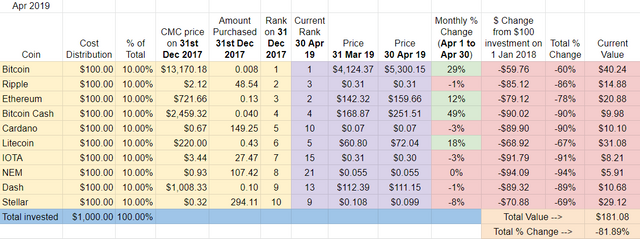
April marked yet another solid month – we’ve now seen three strong months in a row. While 6 out of the 10 were flat or slightly down, the remaining four cryptos more than made up the difference, gaining between +12% and +49%.
Ranking
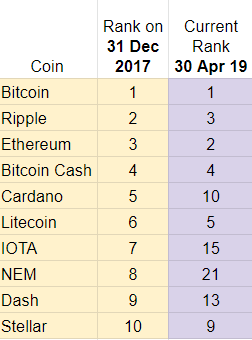
Just two cryptos moved this month. Stellar dropped from #8 to #9 and Bitcoin Cash moved up two spots from #6 to #4 after a very strong April.
NEM, Dash, and IOTA are Top Ten dropouts – they have been replaced by EOS, Binance Coin, and Tether. NEM holds the dubious distinction of being the first crypto in the experiment to have fallen out of the Top Twenty.
April Winners – Here’s something you don’t see everyday: Bitcoin Cash absolutely crushed the field this month, up +49% in April. In fact, this was the first time Bitcoin Cash has ended a month outperforming its Top Ten peers since I began the experiment 16 months ago. Bitcoin finished second this month, up nearly +30%
April Losers – Stellar had a tough April, finishing the month down -8% and dropping a place in the ranking. The rest were either flat or down a few percentage points – no big deal for crypto.
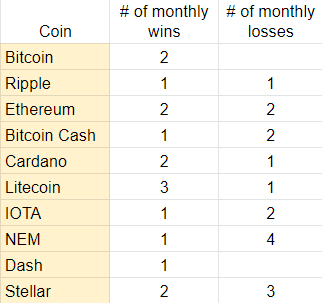
For those keeping score, here is tally of which coins have the most monthly wins and loses during the first 16 months of this experiment. Most monthly wins (3): Litecoin. Most monthly loses (4): NEM. Special mention goes to Bitcoin Cash which finally logged its first win this month.
Overall update – Back and forth between Bitcoin and Stellar continues. NEM and IOTA at the bottom.
Stellar‘s tough month dropped it from overall experiment champion to third best performing crypto over the life of the experiment. Bitcoin regained the lead, now ‘only’ down -60% from January 2018 and now Litecoin has passed Stellar as well.
Bitcoin Cash’s phenomenal April allowed it to barely crawl out of the cellar, but is still down -90% since the beginning of the experiment. NEM is the worst overall performer (down -94%) followed by IOTA which is down -91%. My initial $100 investment in NEM is worth just $5.91 and IOTA is worth $8.21.
Total Market Cap for the entire cryptocurrency sector:
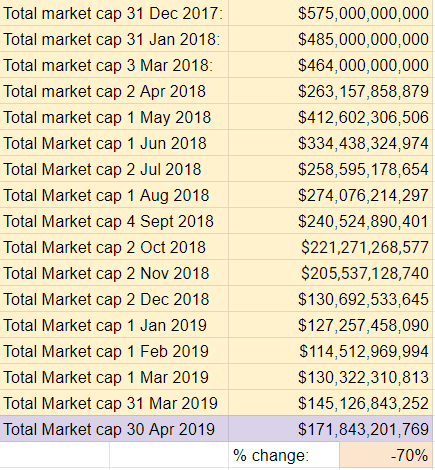
The total crypto market cap increased over $25B in April, up +18% from last month’s report. It is down -70% since the beginning of the experiment, January 1st, 2018. At $171B, the market is at its highest point since November 2018.
Bitcoin dominance:
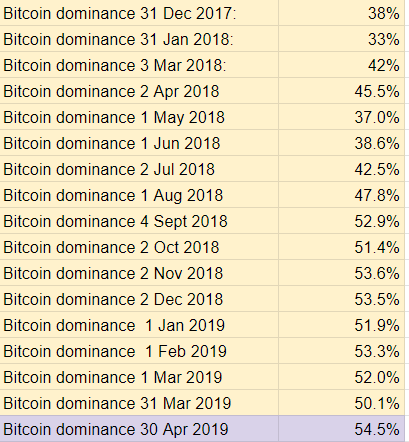
Bitcoin dominance jumped quite a bit in April, now standing at nearly 55%. This is the highest point Bitcoin dominance has reached so far in the experiment.
Overall return on investment from January 1st, 2018:

My Top Ten of 2018 portfolio increased nearly $15 in total value this month. Another tiny gain, but noteworthy, as ending three months in a row in positive territory is a first so far in the experiment.
If I cashed out today, my $1000 initial investment would return about $181, down -82%.
Another rare event: I have almost always ended months setting a record low in terms of value over the life of the experiment. April marks the third month in a row where this has not the case.
Implications/Observations:
Recording three solid months in a row is new territory for this experiment. While it feels like the bottom could drop out again any day, the string of positive months keeps increasing.
Of note this month is the record high Bitcoin dominance, the highest since the experiment started in January 2018. This, coupled with the rise in the crypto market cap, shows that while enthusiasm for crypto is growing, it is focused on the most well know options – people are cautious at the moment about investing in altcoins, but seem to be more willing to invest in Bitcoin.
On a related note, Bitcoin reclaimed the overall lead this month in a convincing manner – it is 7% ahead of second place Litecoin.
The experiment’s focus of solely holding the Top Ten continues to be a losing proposition. While the overall market is down -70% from January 2018, the cryptos that began 2018 in the Top Ten are down -82% over the same period of time. At no point in the experiment has this investment strategy worked: the initial 2018 Top Ten continue to under-perform compared to the market overall.
The 12% difference is up significantly from last month’s 8% difference. It is the widest gap so far and was also seen at one point last year (September 2018).
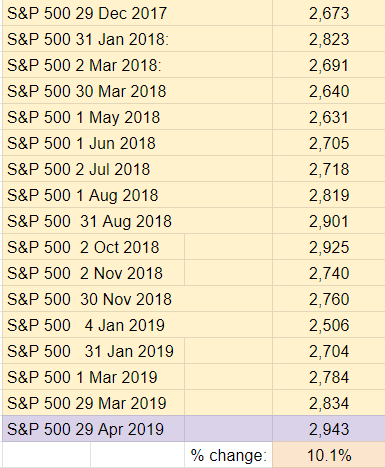
I’m also tracking the S&P 500 as part of my experiment to have a comparison point with other popular investments options. After a pretty significant December dip, the stock market continues to rebound. It’s up over +10% since the beginning of 2018, so that $1k investment I threw into crypto would have yielded +$100.
Conclusion:
February, March, and now April have been quietly solid months for crypto. I personally would be quite satisfied to have these slow, steady $15B-$25B monthly gains for a while instead of the volatile periods, but it does feel a bit like the calm before the storm.
Thanks for reading and the support for the experiment. I hope you’ve found it helpful. I continue to be committed to seeing this process through and reporting along the way. Feel free to reach out with any questions and stay tuned for progress reports.
This article contains affiliate links. If you click on a link in this article, I may earn a small commission at no extra cost to you.
Help keep the lights on at the Top Ten Crypto Index Fund Experiments.
Donate directly:
Bitcoin: bc1qqy4tlwydyrm3sjpyyq88es0cu9j9mdvqer3gwv
Ethereum: 0xC04Bc1996320f27c0A6018cB370c9469a9Dd3a4C
ADA: addr1qywnu55t8hpk4c3jf63tj5xywzej0uhwh7yput4u2z3fq7qa8efgk0wrdt3ryn4zh9gvgu9nylewa0ugrchtc59zjpuqlj6stg
XLM: GA5GJ2JDWC3GB3YXEVRBSR7UBLIB2ROIWZ5FEHML5WXGY5N3PAIDEOEA